Each of the automation database table maintenance areas shares some characteristics and interface controls, which are documented in this topic.
In this topic |
|---|
Some functionality discussed in this section may not be available in some maintenance displays because the functionality is not applicable for that maintenance area.
Data Display
All database tables are displayed in tabular format - rows of information, each containing columns of individual record field information (properties). The display of records for a given table can be manipulated in a number of different ways to organize or limit information that is shown. Information can be sorted, grouped and filtered for ease of working with specific data records. Additionally, individual columns in the table can be moved and resized to suit your needs.
|
XStudio does not "remember" data display layout settings from one session to the next. When re-opened, tables will display the information in the application default sort order and column layout. |

Sorting Data
As a default, most database tables are shown in what's known as "sorted order". This means that the data is organized, generally alphabetically, based on a particular column (field). The sort order, ascending or descending, can be modified on demand. Columns that are a part of the current sort order contain a small triangular mark pointing either up or down to indicate the column's sort direction.

Sorting Data
To sort displayed information on a particular column, click on the column's header text. Initially, the data is sorted ascending. To sort the data descending, click on the column's header text a second time.
You can also sort on multiple columns where applicable. After setting the sort order on the first column, hold down the [Shift] key and click on a second column's heading text. Both columns are now included in the sorting, first by the original column, then for equal values in the first column, by the second column.
To remove a column from a group of columns used for sorting, hold down the [Ctrl] key and click on the column's header text. The selected column will no longer be included in data sorting.
|
Not all columns in some data table displays have sorting available. If you attempt to sort on a column that does not have sorting enabled, nothing happens. |

Grouping Data
Another way to organize displayed data is to group the information based on like data. For instance, you may wish organize the display so that all Tasks of the same kind are together. When grouping is available for a displayed table, a group panel, as shown, is visible. To group information based on a given column, press and hold the left mouse button down on the column header text, drag the column into the group panel and drop it.

Grouping Data
When grouping of data is applied, the resulting display is similar in appearance to the example shown below.

Data grouped by Task Type
You can group on multiple columns where applicable. The effect is to have groups within groups, also known as sub-groups. To add a column to the current grouping, drag another column into the group panel as you did with the original column.
|
Grouping is not available for all columns in some data tables. If you attempt to drag a column into the group panel that is not allowed, the mouse cursor changes to indicate dropping the column in the group panel is not allowed. |
Filtering Data
Displayed records can be reduced to just those items you wish to view using data filters. There are two ways to filter data - by using the dropdown list of filters for a given column of data, and by creating your own custom filters.
To use the built-in column filtering, click on the filter access button for a given column.

Drop-down filter list
Select an item from the list of available filter criteria to display only selected records.

Data filtering active
Data filtering can be temporarily disabled, if desired. Uncheck the filter in the active filter panel and all data will again be displayed. To re-enable the filter, check the filter item in the active filter panel.
|
Filtering is not available for all columns in some data tables. In a given table display, columns that can be filtered display a dropdown list graphic. Columns that do not support filtering do not contain the filter graphic. |
Custom Data Filters
In addition to standard filtering using the dropdown lists for columns, you can also create more complex filtering using custom data filters. To display the custom filter builder dialog, click on the [Customize] button in the filter panel.

Launch filter builder dialog
The custom filter builder dialog allows you to modify current filter parameters and to add fields (columns) to the data filter, creating complex filters.

Filter builder dialog
Filters you create can be saved using the [Save As] button and later reloaded using the [Open] button.
|
You can use wild-card characters in filters. The "_" (underscore) character is used for single-character wildcards, the "%" (percent) symbol is used for multi-character wild-cards. |
Adjusting Column Size and Position
Data display columns can be both moved and resized to accommodate your needs. To change the width of a column, move the mouse over the end of the column you wish to resize. The mouse cursor shape changes as shown. Press and hold the left mouse button down, then move left or right to decrease or increase the width of the selected column.

Resizing a column
You can reorder columns by moving a column to a different location. To move a column, press and hold the left mouse button down on the column header text. Drag the column header to another location and drop it. As shown, a pair of arrows appears as you are dragging the column header, indicating the new position of the column if you drop it.

Moving a column
Resizing or moving column display information has no effect on the data - the changes made are cosmetic and are available for users to customize the display for ease of use.
Data Navigators
Several areas in XStudio make use of so-called "data navigators." Essentially, a data navigator is an organized set of buttons that provides an easy-to-use interface for navigating around in displayed data like the log, station definitions, cart masks, and music databases. In addition to navigation, some of the navigators include buttons to add (insert), edit, & delete items.
Two example navigators are shown here – there are two because the "state" (availability) of buttons will vary depending on the current task. For instance, if you are at the beginning of a log, the navigator buttons for moving backwards through the log are disabled – at least, until you move away from the beginning of the log.
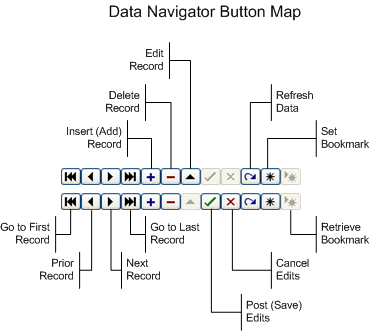
Depending upon the area of XStudio in which you’re working, some of the navigator buttons depicted are not visible because the functionality they provide is not allowed.
Printing Lists
Most of the maintenance areas provide an option to print selected information, such as external resource maps and action task lists, for reference purposes. Typically, the print option is a part of pop-up context menus. The printer used is the operating system's default printer.