A data view is set of information that defines how data is displayed when looking at an audit report. This set of information includes things like the specific columns of information that will be displayed and grouping of information (by day, by hour, etc.).
ezSuite features a number these views pre-defined for both standard audit reports and multi-day audit reports. The pre-defined views cannot be modified.
However, there are times when you might want to view - or print - an audit report with an appearance different from the pre-defined data views. ezSuite provides the means to make a copy of an existing data view, then edit it to suit your purpose. Or, you can create a completely new data view from scratch. User-defined data views are saved automatically when you close an audit report window and will be available for use the next time you open a report.
|
Creating and saving your own data views will affect the time it takes to open an audit report dialog. The larger the number of user-defined views, the longer it will take to recreate those views when opening a report dialog, as they are reloaded from disk. |
Creating a User-Defined Data View
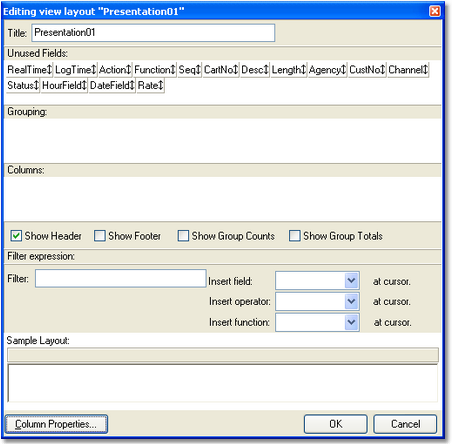
To create a new view, select the menu item Edit | Data Views | Create New Layout. You'll be prompted for a name for the view and a dialog similar to the one shown here will appear:
In this dialog, you select the columns (fields) you want displayed by dragging items from the "Unused Fields" list to the "Columns" list. As you drop a field on the columns list, the "Sample Layout" near the bottom of the display is updated to reflect the appearance of the data view. You can also group items by dragging an unused field to the "Grouping" list. For instance, dragging the field named "HourField" in the above example will cause all data for a specific hour to be grouped together.
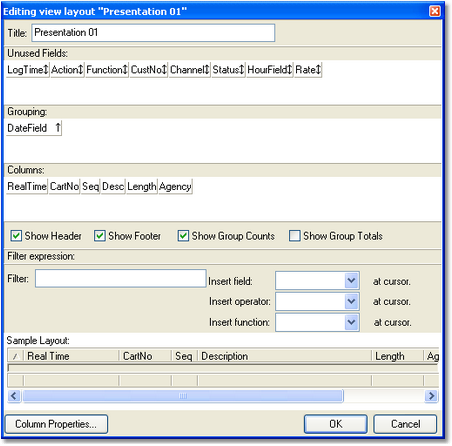
Here's an example of the dialog once some fields have been dropped and a group field assigned:
This particular example would be used in a multi-day report and groups the information by log date ("DateField"). Displayed information will include the actual air time ("RealTime"), the cart number, sequence (cut, if any), the description, length, and agency field information. This sort of layout would be useful, for instance, if you needed to generate a report for a customer that reflects all times a spot ran for a given date range. Information that the advertiser would not be interested in is not displayed, making for an easier-to-understand report for the customer. You may have noticed another field in the layout, called "Rate" - it was included as an example of a User-Defined Field being used in a custom view.
You can also choose whether or not to display column headings ("Show Header" check box), footers, Group Counts (recommended if you are grouping items) and Group Totals.
Once you have organized the fields you want displayed, click on the [OK] button to save your changes. The main report display will reappear, with data displayed using your new data view.
Using Filter Expressions
You may have noticed a section in the dialog entitled "Filter Expression:". This section allows you to further filter information based on very flexible criteria.
|
If you create a Filter Expression in a data view, the Cart Filters combo box on the main display is disabled and only the filtering criteria you've established in the Filter Expression is used to determine the visibility of specific items. Cart filters and Filter Expressions are mutually exclusive. |
A Filter Expression has three (3) parts - a field to operate on, an operator ("=", ">", etc.), and a function. You can experiment with Filter Expressions by creating one, saving the data view and reviewing the results. If the results are not what you want, simply edit the data view and revise the Filter Expression until you get the desired results. If you wish to remove a filter expression, simple delete the contents of the Filter field by backspacing until the field is empty.
Filter Expressions can be simple or quite complex. Here are some example Filter Expressions and their meaning:
Expression |
Meaning |
|---|---|
LogTime > DATE '1899-12-30' |
Using the field "LogTime", display only records whose date is greater than December 30, 1899. The effect is that only items that were on the log will be displayed in the data view. |
CartNo = 'J104' |
Using the field "CartNo", display only records whose cart number is J104. This would be similar to the standard Cart Filter. |
CartNo = 'J104' OR CartNo = 'J105' |
Using the field "CartNo", display only records whose cart number is J104 OR J105. This would be similar to the standard Cart Filter. |
LogTime > DATE '1899-12-30' AND CartNo = 'J104' |
Using the field "LogTime", display only records whose date is greater than December 30, 1899 AND using the field "CartNo", display only records whose cart number is J104. The effect is that only items that were on the log AND have a cart number of J104 will be displayed in the data view. |
Setting Column Properties
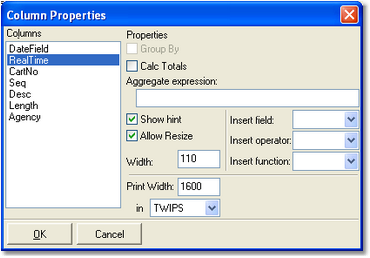
You can edit various column settings for your data view by clicking on the [Column Properties] button. A dialog similar to the one shown here appears:

As you can see, there are several items you can modify. Of these, the one most often used is the "Print Width" property. This value controls with width of the selected field when printing and is independent of the displayed width. You can change this setting using any of the available measurement types in the dropdown combo box. The most common measurement width is "Inches".
You can also cause the selected field to be totaled, if desired, by checking the "Calc Totals" check box. The total value for the field is displayed in the footer for the column associated with the field, if the custom report's "Show Footer" check box is checked. The displayed value is equivalent to an Aggregate Expression of "SUM(FieldName)".
|
The use of Aggregate Expressions is beyond the scope of this documentation. It is recommended that the Aggregate Expression field be left empty. Aggregate Expression results are displayed in the footer of a column and the "Calc Totals" check box must be checked. A sample of an Aggregate Expression that formats a dollar value and puts the dollar sign in front of the value is: '$ ' + FORMATNUMBER(SUM(RATE),2,TRUE) |


