iDAF Extended Event Logging |

  
|
You can force iDAF to increase the detail level as it "tracks" what's happening within the application. To do so, add the command-line switch "/debug" (no quotes) to your iDAF shortcut. For more information on command-line switches, see the topic Command Line Switches.
|
You can temporarily enable additional application logging detail by checking the menu item Help | Extended Event Logging. This enables extended event logging for the current session only. |
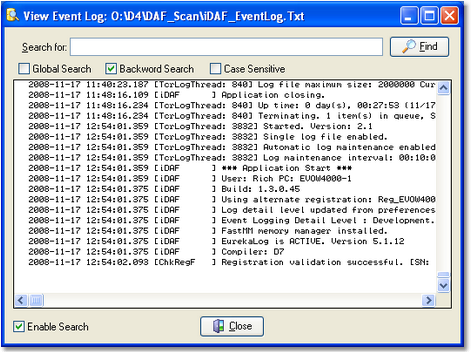
When you run iDAF, actions the program takes, along with actions you take, are recorded to a file in the iDAF application directory. You can view the file while using iDAF by selecting Help | View Application Event Log, or view it later using a standard text editor like NotePad. The application event logging file name is documented in the topic List of Files. The application event log view is similar to the following:

Use the horizontal and vertical scroll bars to navigate the display. Standard [PgUp] and [PgDn] keystrokes work, too. You can search for specific text in this dialog by checking the "Enable Search" item, which reveals a panel for entering the text to search for, setting search direction and other options.
|
When viewing text, you can assign up to 10 temporary bookmarks. To assign a bookmark, use the keystroke combination [Ctrl-Shift] + 0 to 9. A small marker becomes visible in the left margin of the line. To jump to a bookmark, use the keystroke [Ctrl] + 0 to 9. Bookmarks are lost when the dialog is closed. |